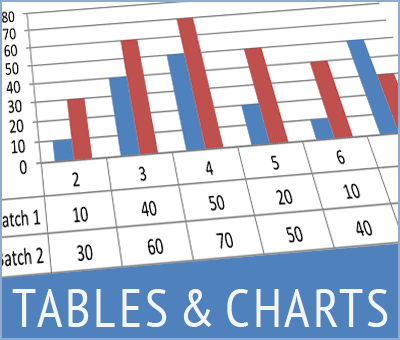
Statistical Data Tables and Charts
Displaying tables and charts directly in pages is a great way to disseminate statistical data and illustrate your pages. Here are some tips for NSO websites owners and administrators.
Displaying tables and charts directly in pages is a great way to disseminate statistical data and illustrate your pages. Here are some tips for NSO websites owners and administrators.

Because your country officially uses more than one language or simply because you want to make your content available to a wider audience, you might want to translate the content of your website. Here’s how.
Every Statistics Office website have a few features in common, one of them is the document library where NSO share reports, spreadsheets, and all kinds of documents with their users.

Adding images on a website certainly helps to illustrate your posts and pages, and generally makes websites more attractive. That said, there are a few rules that must be followed in terms of design, but also legal wise.

Videos are a great way to highlight an event, communicate on a forthcoming census, or simply present your office.
While publishing videos online is now fairly common thanks to social plateforms, here are a few tips to do it right on a NSO website.

Easily add twitter feed to your website (page or post) by using on of the 3 technics available on your website.
Recent Comments