Why using tables
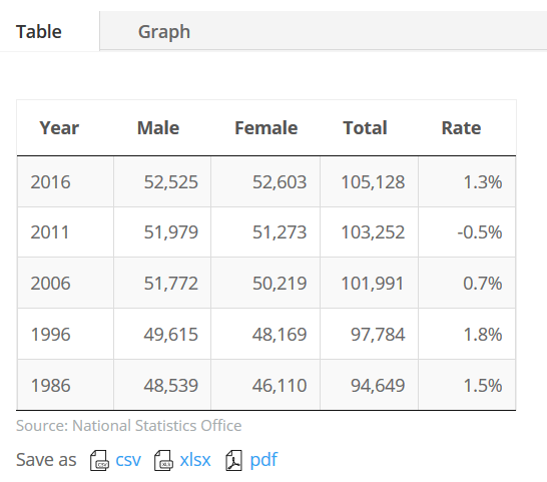
Displaying tables directly in pages is a great way to quickly disseminate statistical data without making your users having to download a document or read through a long report.
It is also a good way to keep updating your website, which increases your score in search engines (regular updates) and letting your users know how often you collect or publish new data.
PROS
- Quick access to data
- Easy to read
- Indexed by search engines
CONS
- Suitable for simple datasets only
- Time consuming
- Responsiveness issues (big tables)
We should add tables for summary data or simple time series only, and use excel sheets or PDF reports (or even better, a real database application) to publish complex data.
Option 1: Create tables within pages or posts
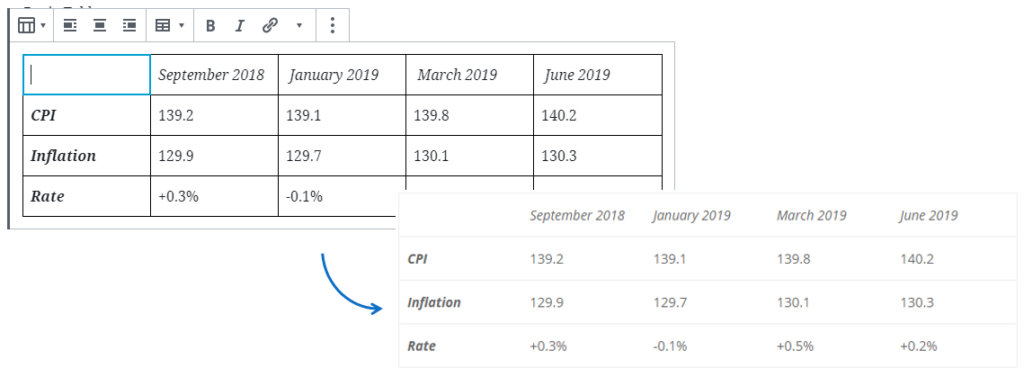
Gutenberg (and Advanced Gutenberg) provide blocks to create simple tables directly within the editor. The Divi Page Builder does not provide such blocks (see option 2 if using Divi editor).
PROS
- Lightweight
- Easy to use
CONS
- Basic layout options
- Limited Copy / Paste features
- Can not import (e.g. from Excel)
- Only available in Gutenberg
Option 2: The Tables by Supsystic plugin
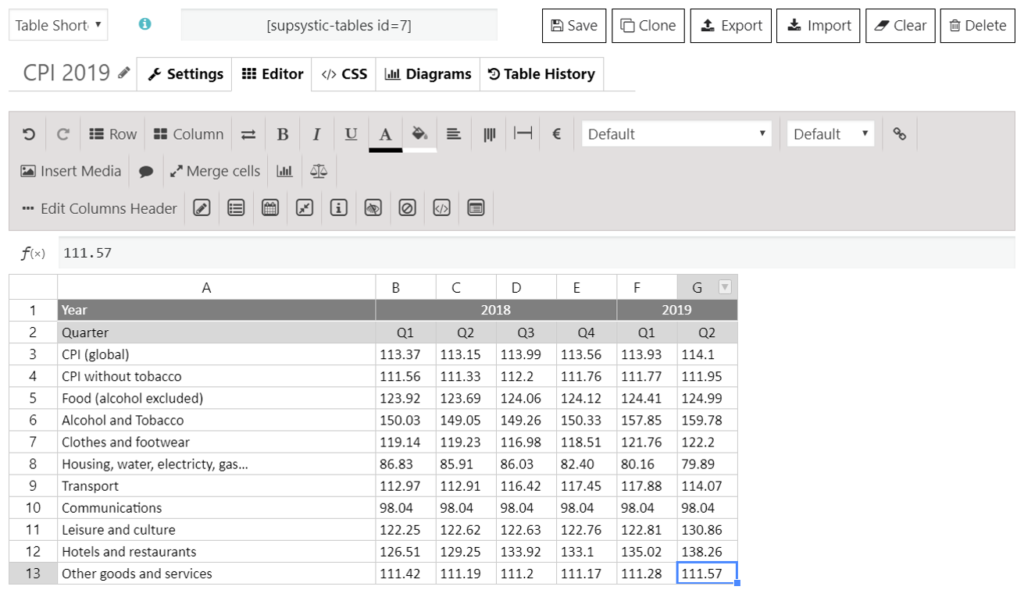
There are a few plugins available out there (both free and commercial), but the one that seems to fit our needs the most (in the context of data dissemination) is the Tables by Supsystic plugin.
All tables you create are saved and managed in one place, under the Tables by Supsystic administration menu. You can then add them in your pages and posts by copying and pasting a shortcode, no matter what editor you used (Gutenberg or Divi Page Builder).
PROS
- Copy and paste
- Import from Excel
- Synchronize with Google Sheets
- Advanced layout and style options
- Download data as CVS, Excel or PDF
- Integrate table in any kind of page or post
CONS
- Responsive bugs when using merge cells
- Limited data formats available (especially with numbers)
Generate charts from tables
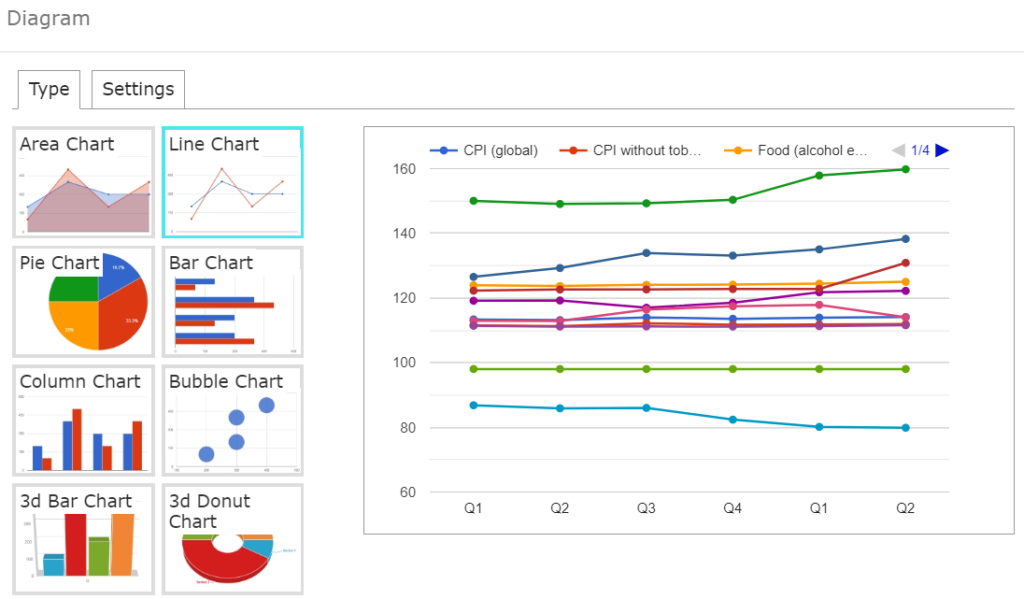
Another great feature of the Table by Supsystic plugin is the ability to generate charts, directly from the data you enter in tables. Bar charts, pir charts, donuts… all kinds of diagrams are available.
You simply integrate them in pages the same way you add your tables (using short codes). This avoids the need to create images and upload them to your website everytime you need to display a chart, and they are updated automatically whenever you change or add data in your tables!
Full documentation
To learn all about the Tables by Supsystic plugin and how to use it, please check the official documentation:
- Official Video (youtube)
https://www.youtube.com/watch?v=RZ2I-aCiLZE - User and administrator manual
https://supsystic.com/docs/data-tables/
Recent Comments