In a previous blog post, we demonstrated the use of a plugin to create charts out of datasets hosted on PDH.stat.
Today, I will show you how you leverage the HighchartsJS library to create charts to display datasets that are sitting in a HTML tables on the same page.
Let’s see first the result to get a better idea of what we are talking about:
In the above example we used a tabbed component to integrate a chart and the associated table but other configurations will also work. As long as the table is sitting somewhere on the same page, the chart library will be able to pick the data from it.
To achieve that, we will need to add some custom HTML pieces of code to the page:
- a <div> container for the chart
- the HTML table containing the data
- the JavaScript code that creates the chart
With WordPress Block Editor and Divi Builder we have multiple options to insert these pieces of code into the page.
We will explore some of them in this post. Next section provides guidelines to integrate a chart using the Divi Builder whereas the following one will focus on the use of the blocks provided by the WordPress Block Editor.
Divi Builder

In this part of the tutorial, I will continue with the example provided above: adding a tab module with the chart embedded in the first tab and the table in the second one.
Multiple options are available within Divi when it comes to embed custom code in a page:
- the Code module in the Divi Builder editor:

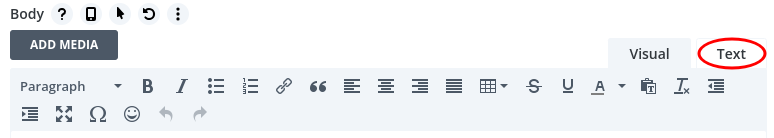
- Text, Toggle and even Tab modules provide a way to edit the underlying HTML code via Body>Text
As for adding a HTML Table, it can also be done using the WYSIWYG editor available in Text, Toggle, Tab modules. Just use the Table button:

The table can be created from scratch or even be copied out of another web page or a PDF document.
1. HTML Table
The table is created via the WYSIWYG editor.
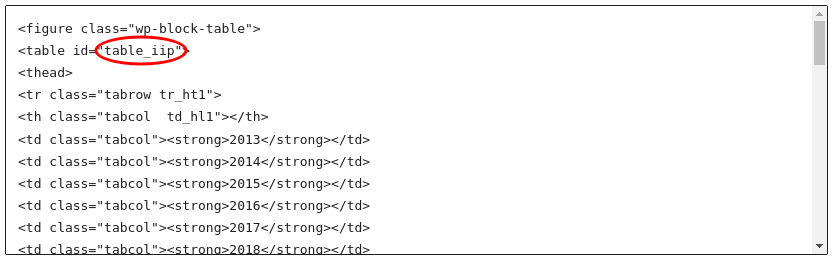
We need to add an id to the table for the JavaScript to be able to find the table. To do so, we have to change the underlying HTML code, there is no option available in Divi Builder to do it directly. We will use the “Text” tab of the WYSISYG editor like presented below:
In the example, the table is inserted in the tab named “Table”. The HTML table id “table_iip” will be then reused in the JavaScript code.
2. Chart container
A div container will be added to the page to host the chart that will be used by the JavaScript code. The chart will be created at the exact location of this container in the page.
To insert custom HTML code, once again we will use the “Text” tab.
In the previous example the chart will be visible in the second tab (named “Chart”)
The code added in the chart tab is the following:
<div id="container_iip"></div>3. JavaScript code
The JavaScript can be inserted anywhere in the page with the Divi Builder Editor. Using the Code module for instance:
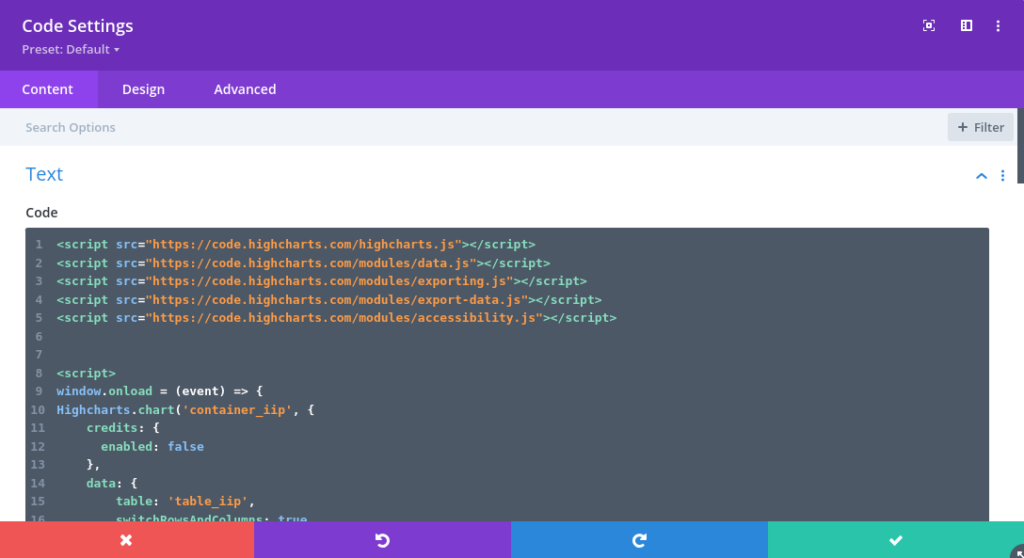
The content of the code is explained in a separate section here.
Click here to view the full code
<script src="https://code.highcharts.com/highcharts.js"></script>
<script src="https://code.highcharts.com/modules/data.js"></script>
<script src="https://code.highcharts.com/modules/exporting.js"></script>
<script src="https://code.highcharts.com/modules/export-data.js"></script>
<script src="https://code.highcharts.com/modules/accessibility.js"></script>


<script>
window.onload = (event) => {
  Highcharts.chart('container_iip', {
    credits: {
      enabled: false
    },
    data: {
        table: 'table_iip',
    	switchRowsAndColumns: true,
        parsed: function (columns) {
          // replace inline the cells values that contains comma with parsed integer
          columns.forEach((column,index)=>{
            if (index > 0) {
          	  column.forEach((cell,index_cell)=>{
            	  if (index_cell > 0 && typeof cell == 'string') {
              	  columns[index][index_cell] = parseFloat(cell.replaceAll(',', ''))
                }
              })
            }
          });
        }
    },
    chart: {
        type: 'line'
    },
    title: {
        text: 'International Investment Position'
    },
    subtitle: {
        text:
            "Fiji's International Assets and Liabilities"
    },
    xAxis: {
        type: 'category'
    },
    caption: {
        text: '(p) provisional'
    },
    yAxis: {
        allowDecimals: false,
      	title: {
          text: 'FJD Millions'
        }
    }
  });
}
</script>
WordPress Block Editor

The WordPress Block Editor enables the edition of the underlying HTML code for every modules, via the 3 dots menu:
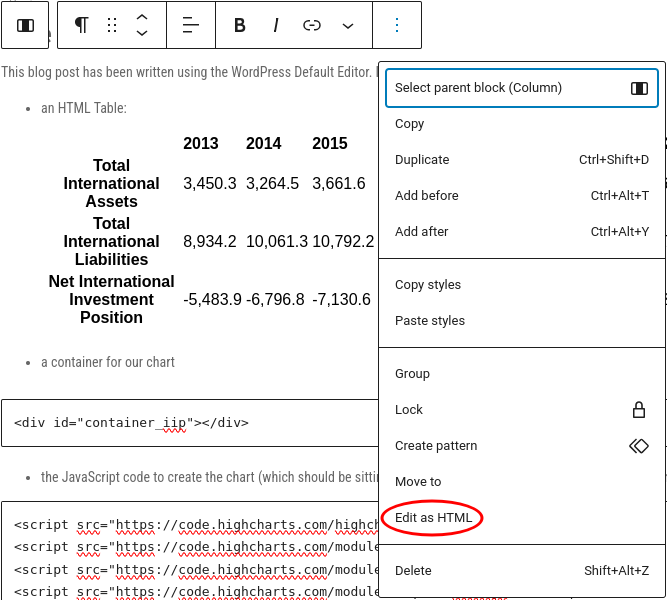
1. HTML Table
With the WordPress Default Editor, the table can be created via the Table block.

But we can also use the Custom HTML block to insert a table via the HTML syntax <table>
In both cases, an id must be set for the <table> element via “Edit as HTML”:
2. Chart container
We need to insert a container to our chart that will be used by the charting library to insert the component. The chart will be created by the JavaScript code at this exact location. In Block Editor we would use the “Custom HTML” block for that.
<div id="container_iip"></div>3. JavaScript code
The JavaScript code relative to the above example is available here:
Click here to view the full code
<script src="https://code.highcharts.com/highcharts.js"></script>
<script src="https://code.highcharts.com/modules/data.js"></script>
<script src="https://code.highcharts.com/modules/exporting.js"></script>
<script src="https://code.highcharts.com/modules/export-data.js"></script>
<script src="https://code.highcharts.com/modules/accessibility.js"></script>


<script>
window.onload = (event) => {
  Highcharts.chart('container_iip', {
    credits: {
      enabled: false
    },
    data: {
        table: 'table_iip',
    	switchRowsAndColumns: true,
        parsed: function (columns) {
          // replace inline the cells values that contains comma with parsed integer
          columns.forEach((column,index)=>{
            if (index > 0) {
          	  column.forEach((cell,index_cell)=>{
            	  if (index_cell > 0 && typeof cell == 'string') {
              	  columns[index][index_cell] = parseFloat(cell.replaceAll(',', ''))
                }
              })
            }
          });
        }
    },
    chart: {
        type: 'line'
    },
    title: {
        text: 'International Investment Position'
    },
    subtitle: {
        text:
            "Fiji's International Assets and Liabilities"
    },
    xAxis: {
        type: 'category'
    },
    caption: {
        text: '(p) provisional'
    },
    yAxis: {
        allowDecimals: false,
      	title: {
          text: 'FJD Millions'
        }
    }
  });
}
</script>
The “Custom HTML” block can be used here as well.
Live Demo
It is time for a live demo now. This blog post is written with WordPress Block Editor sorry for the Divi users :-). A live example of an integration in a Divi Builder page is available here.
The following elements demonstrate the setup of the chart with the 3 different elements:
- an HTML Table:
| 2013 | 2014 | 2015 | 2016 | 2017 | 2018 | 2019 | 2020 | 2021 [p] | |
| Total International Assets | 3,450.3 | 3,264.5 | 3,661.6 | 3,533.2 | 4,085.8 | 3,482.3 | 3,749.1 | 3,648.1 | 4,978 |
| Total International Liabilities | 8,934.2 | 10,061.3 | 10,792.2 | 11,300.7 | 12,524.4 | 13,626.3 | 15060.1 | 15702.1 | 17,652 |
| Net International Investment Position | -5,483.9 | -6,796.8 | -7,130.6 | -7,767.5 | -8,438.6 | -10,144.0 | -11311.0 | -12054.0 | -12,674.8 |
- a container for our chart
- the JavaScript code to create the chart (which should be sitting here but is invisible as there is no HTML element rendered here)
JavaScript code
In this section I will try to give insights on the content of the JavaScript code snippet, this might be the trickiest part of this tutorial!
The provided snippet should be easily extended to generate multiple sort of charts.
Click here to view the full code
<script src="https://code.highcharts.com/highcharts.js"></script>
<script src="https://code.highcharts.com/modules/data.js"></script>
<script src="https://code.highcharts.com/modules/exporting.js"></script>
<script src="https://code.highcharts.com/modules/export-data.js"></script>
<script src="https://code.highcharts.com/modules/accessibility.js"></script>


<script>
window.onload = (event) => {
  Highcharts.chart('container_iip', {
    credits: {
      enabled: false
    },
    data: {
        table: 'table_iip',
    	switchRowsAndColumns: true,
        parsed: function (columns) {
          // replace inline the cells values that contains comma with parsed integer
          columns.forEach((column,index)=>{
            if (index > 0) {
          	  column.forEach((cell,index_cell)=>{
            	  if (index_cell > 0 && typeof cell == 'string') {
              	  columns[index][index_cell] = parseFloat(cell.replaceAll(',', ''))
                }
              })
            }
          });
        }
    },
    chart: {
        type: 'line'
    },
    title: {
        text: 'International Investment Position'
    },
    subtitle: {
        text:
            "Fiji's International Assets and Liabilities"
    },
    xAxis: {
        type: 'category'
    },
    caption: {
        text: '(p) provisional'
    },
    yAxis: {
        allowDecimals: false,
      	title: {
          text: 'FJD Millions'
        }
    }
  });
}
</script>
First we import the Highcharts library into our page and some of its modules.
data.jsis needed to be able to read data from the HTML pageexporting.jsandexport-data.jsare used to enable the export features available with the hamburger buttonaccessibility.jsis here to guarantee that the chart is as accessible as possible.
<script src="https://code.highcharts.com/highcharts.js"></script>
<script src="https://code.highcharts.com/modules/data.js"></script>
<script src="https://code.highcharts.com/modules/exporting.js"></script>
<script src="https://code.highcharts.com/modules/export-data.js"></script>
<script src="https://code.highcharts.com/modules/accessibility.js"></script>
Then we instantiate a new chart with the following JavaScript code. Ids for both chart container ("container_iip") and data table (“table_iip“) are reused here. Note that because of the presentation of this table (years displayed in columns) we need to activate the switchRowsAndColums option. Values that are presented with a decimal separator (,) are parsed into numbers.
window.onload = (event) => {
  Highcharts.chart('container_iip', { // first argument is the
    credits: {
      enabled: false // this is to remove highcharts credits
    },
    data: {
        table: 'table_iip', // here we enter the id of the data table
 	switchRowsAndColumns: true, // Highcharts expects the data points in rows
        parsed: function (columns) { // this is to manage the numbers with decimal separator
          columns.forEach((column,index)=>{
            if (index > 0) {
          	  column.forEach((cell,index_cell)=>{
            	  if (index_cell > 0 && typeof cell == 'string') {
              	  columns[index][index_cell] = parseFloat(cell.replaceAll(',', ''))
                }
              })
            }
          });
        }
    },
    chart: {
        type: 'line' // chart type
    },
    title: {
        text: 'International Investment Position'
    },
    subtitle: {
        text: "Fiji's International Assets and Liabilities"
    },
    xAxis: {
        type: 'category'
    },
    caption: {
        text: '(p) provisional'
    },
    yAxis: {
        allowDecimals: false,
      	title: {
          text: 'FJD Millions'
        }
    }
});
Other examples
Other examples of chart that can be included in a WordPress page :
Population Pyramid
Full code
window.onload = (event) => {
  Highcharts.chart('container', {
    credits: {
        enabled: false
    },
    data: {
        table: 'table_population',
        parsed: function(columns) {
          // replace inline the cells values that contains comma with parsed integer
          columns.forEach((column,index)=>{
            if (column[0] == "Male") {
                column.forEach((cell,index_cell)=>{
                    if (index_cell > 0) {
                        if (typeof cell == 'string') {
                            cell = parseFloat(cell.replaceAll(',', ''))
                        }
                        columns[index][index_cell] = 0 - cell
                    }
                })
            } else if (column[0] == "Female") {
                column.forEach((cell,index_cell)=>{
                    if (index_cell > 0 && typeof cell == 'string') {
                        columns[index][index_cell] = parseFloat(cell.replaceAll(',', ''))
                    }
                })
            }
          });
        },
        complete: function(options)  {
            options.series[0].color = "#9cf"
            options.series[1].color = "#f9c"
            options.xAxis = [{
                categories: options.series[0].data.map((d) => d[0]),
                opposite: false,
                reversed: false,
                labels: {
                    step: 1
                },
            }, {
                categories: options.series[1].data.map((d) => d[0]),
                opposite: true,
                reversed: false,
                linkedTo: 0,
                labels: {
                    step: 1
                }

            }]
            options.xAxis[1].categories = options.series[0].data.map((d) => d[0])
            options.xAxis.min = Math.max(...options.series[0].data.map((d) => d[1])) * -1
            options.xAxis.max = Math.max(...options.series[1].data.map((d) => d[1]))
        }
    },
    chart: {
        type: 'bar',
    },
    title: {
        text: 'Population Estimates (2021)'
    },
    subtitle: {
        text: 'Source: 2010 FSM Census<br/>Scenario assumes a consistent annual growth rate of 0.174% over the projection period.'
    },
    yAxis: {
        allowDecimals: false,
        labels: {
            formatter: function () {
                return Math.abs(this.value);
            }
        }
    },
    legend: {
        enabled: false
    },
    plotOptions: {
        series: {
            stacking: true,
            pointPadding: 0,
            groupPadding: 0,
            borderWidth: 1
        },
    },
    tooltip: {
        formatter: function() {
            return '<b>' + this.series.name + ', Age ' + this.point.category + '</b><br />' + 'Population: ' + Highcharts.numberFormat(Math.abs(this.point.y), 0);
        }
    }
  });

}
Recent Comments